Hello, I'm

Nishant Iyer

Senior Associate at Capital One, in the Refinance line of business.

I used to engineer biology; now I engineer insights. Five years of turning messy data into dashboards, forecasts and models that people actually use to decide things.

About

I started in biotechnology, where my dissertation turned out to be mostly about data analysis. That pulled me into analytics, and I have spent the five years since turning messy data into dashboards, forecasts and models that teams use to make decisions.

Today I'm at Capital One, in the Refinance line of business, turning large data ecosystems into decisions that help customers. Before that I was a graduate student assistant at Temple University and a product analytics consultant for Unilever, helping global stakeholders see where their money was going and how to make more of it.

I work across machine learning, statistical modeling and presenting findings to leadership, from sizing untapped markets for a Colgate-Palmolive campaign to cost-optimized fraud models. Outside work I build end-to-end ML projects with real data and an app you can try, several of them from Kaggle competitions.


Experience
5+ years in data analytics and BI
Education
M.S. Business Analytics, Temple University
Background
Biotechnology
Industries
Banking, consumer goods, higher education, media

Skills and tools

Languages
  • SQL
  • Python
  • Excel VBA
Data engineering
  • Databricks
  • PySpark
  • pandas
BI and visualization
  • Tableau
  • Power BI
  • Looker Studio
  • Excel
Analytics
  • A/B testing
  • Forecasting
  • Segmentation and CLV
  • Marketing attribution
Machine learning
  • XGBoost
  • LightGBM
  • PyTorch
  • SHAP
  • Optimization (MILP)
Apps and deployment
  • Streamlit
  • FastAPI
  • Docker
  • MLflow
  • Git

Experience

  1. Senior Associate

    Capital One Jul 2025 to present

    • Analytics for the Refinance line of business (ReFi LOB).
  2. Graduate Student Assistant

    Temple University (part-time) Jan 2024 to May 2025

    • Automated weekly lead reports with Excel VBA, saving 8+ hours a month and catching data issues sooner.
    • Built Tableau dashboards for the enrollment funnel and ran Python EDA and A/B tests on campaigns, lifting conversion 12% and engagement 20%.
    • Structured data with SQL and pandas for root-cause analysis and new dashboard metrics.
    • Presented insight decks to university leadership to guide planning decisions.
  3. Product Analytics Consultant

    Unilever Jul 2024 to Dec 2024

    • Built Power BI dashboards for pacing and inventory risk, enabling $3M+ in savings across product lines.
    • Automated ingestion of 15M+ records with Databricks pipelines for anomaly detection and real-time reporting.
    • Built regression and trend forecasting models that raised demand accuracy to 96% and reduced stockouts.
    • Defined shared KPIs with product, finance and supply teams, standardizing P&L and POS tracking.
  4. Associate

    GroupM Jan 2022 to Jun 2023

    • Ran SQL-driven attribution models for $3M+ in media spend, improving ROAS 22% and shaping cross-channel strategy.
    • Designed CLV segmentation models and pacing dashboards, reducing churn 18% and increasing repeat purchases.
    • Found 15% untapped markets through stakeholder interviews and demographic analysis, guiding a $1.2M Colgate-Palmolive campaign.
    • Built forecasting tools and automated Excel dashboards for client media planning.
  5. Associate

    First Economy Mar 2021 to Jan 2022

    • Automated reporting with Excel macros and Google Data Studio, cutting reporting lag 70%.
    • Led weekly QA, discrepancy resolution and report refreshes for campaign operations.

Projects

In progress NFL Big Data Bowl 2027

Combine tracking vs NFL movement

My entry for the NFL Big Data Bowl: 10 Hz tracking of every Combine drill, matched to the same players' game tracking, to test what the Combine really tells a team about how a rookie will move on Sundays. The write-up and code go public after the January 2027 deadline.

  • Player tracking
  • Signal processing
  • Empirical Bayes
  • Out-of-sample testing

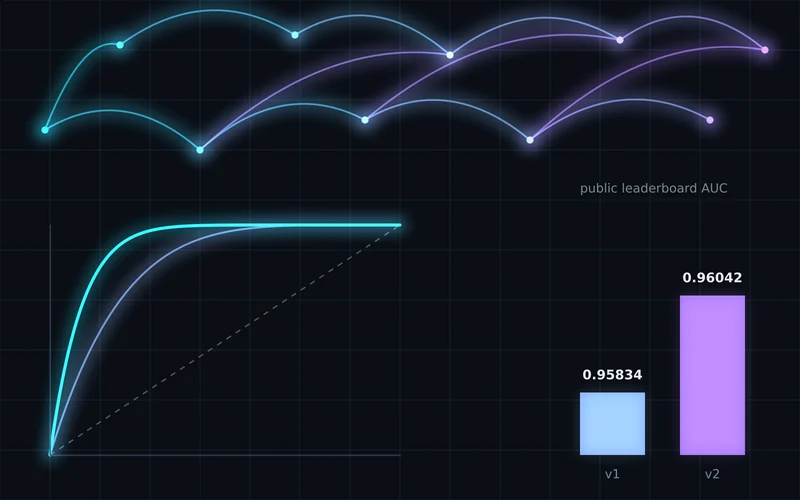
0.9604 AUC, up from 0.9583

Airline satisfaction prediction

Kaggle competition with 700k passengers. Treating flight distance as a route ID, leak-free target encoding and a model trained on the original survey lifted a gradient-boosting blend by 348 leaderboard places.

  • LightGBM
  • XGBoost
  • CatBoost
  • Target encoding

55% win rate on out-of-sample bets

NFL betting market analysis

Tests whether Over/Under lines can be beaten with team strength, form, travel and weather. A walk-forward backtest over 5,460 games finds the edge only when betting selectively, and almost all of it on Unders.

  • XGBoost
  • Optuna
  • Walk-forward testing
  • Kelly sizing